Application of Acrel-3000 Power Management System in Takashimaya
2025-05-28 16:08:48
Introduce Takashimaya, using intelligent power meters to collect various electrical parameters of floor users. The system adopts the on-site local networking mode. After networking, it communicates through the fieldbus and travels to the background. The Acrel-3000 power management system realizes real-time monitoring and management of floor users' electricity.
Yang Junjun
Ankerui Electric Co., Ltd., Jiading, Shanghai 201801, China;
1 Overview
Takashimaya Department Store's 180-year-old Takashimaya is one of the largest chain department stores in Japan. It has more than 20 chain stores in Japan and its revenue in 2007 was the highest among all Japanese department stores. So far, Takashimaya Department Store has only opened three overseas stores, namely New York, Taipei and Singapore, which are among the top local sales charts. Among them, Singapore Takashimaya and Taipei Takashimaya have been linked to local department stores for many years. Industry sales champion.
Shanghai Gaodaowu Department Store is located in the second phase of Gubei International Wealth Center in the golden section of Hongqiao Road and Ruby Road. The second phase of Fortune Center is 30 stories high. It is a high-end commercial, five-star hotel and shopping center. Super 5A Class A intelligent business building.
Our company undertakes the power management system of this project, collects the data of the floor user terminal energy meter in real time, and analyzes and manages the user's power consumption, so as to facilitate the user's real-time understanding of the floor power consumption.
1 Demand analysis
The implementation of this power management system achieves the predetermined goals in the following aspects:
1) Master the operation of the power equipment of each end user;
2) Report on various status monitoring and historical data in the power management system. The system can design and manage multiple report styles to realize daily, monthly and annual report management;
3) data recording and fault data recording;
4) Improve the efficiency of the operation and management of the power management system and greatly improve the management level;
5) Realize fault information alarm, alarm inquiry, set pre-alarm signal and fault alarm signal, prompt the user through sound and light, interface, etc., wait for the user to confirm and reset, and can provide alarm information printing function.
6) Powerful user management function, the system records each administrator's operation record, operation record, etc., and sets up multiple levels of users, respectively assign different permissions and corresponding passwords to ensure safe operation. Realize no or few people on duty in each substation;
2 system plan
The monitoring system mainly implements power management for the end users of Shanghai Gaodaowu. The monitoring scope is remote real-time data acquisition, processing, analysis and display of the end user. The system accesses 461 terminal meters in the floor electric well, which is divided into 22 buses. The bus directly accesses the indoor collection equipment of the duty, so that the data connection between the instrument on the bus and the monitoring host is realized on the monitoring host. As shown in the figure below: station management layer, network communication layer and field device layer.
1) Station management
The management of the station control management system for the power monitoring system is a direct window for human-computer interaction. It mainly refers to the industrial computer, display, UPS, printer, etc. placed in the duty room.
2) Network communication layer
The communication layer is mainly composed of two NPORT5610-16 serial servers, protocol isolation converters, Ethernet devices and bus networks. The main function of the NPORT5610-16 serial server is to monitor the on-site intelligent instrument; the main function of the Ethernet device and the bus network is to realize data interaction, make the distribution system management centralized, informative and intelligent, and greatly improve the safety of the power distribution system. Sex, reliability and stability have truly achieved unattended goals.
3) Field device layer
The field device layer is a data acquisition terminal, which is mainly composed of smart meters. The smart meter connects to the communication server through the shielded twisted pair RS485 interface, and uses the MODBUS communication protocol bus type connection to reach the communication server through the communication server to realize the networking. remote control.
Smart meter field connection
The field instrument is connected by hand-shielded through the shielded twisted pair cable (RVVSP2*1.0). The number of smart meters connected to each bus is about 24, and then the data is uploaded to the serial port server NPORT5630-16, and the data is uploaded to the local monitoring. terminal. The specific connection diagram is as follows:
.jpg)
The user side uses the terminal meter DDSD1352-C and DTSF1352-C to measure single-phase (three-phase) voltage, current, active power, reactive power, frequency, power factor and so on.
3 system function
Features
The system adopts full Chinese interface, and the operation is simple and convenient; the operation is stable and reliable. Click the corresponding shortcut button to enter the corresponding system function module; the system has the terminal meter power consumption display, simulation map display and network structure diagram display; the system provides a friendly human-computer interaction interface, all operations can be performed on the interface And has a remote display function.
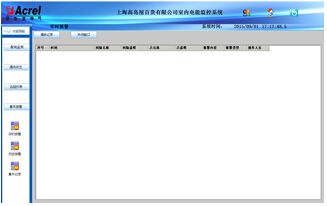
login interface
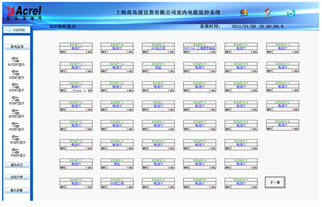
After the software enters the corresponding password, it can enter the monitoring system interface and view the monitoring data. Otherwise, it cannot be viewed. The user name is divided into "administrator" and "operator". The two permissions are different. The operator can only operate some functions, and the administrator has the highest authority.
.jpg)
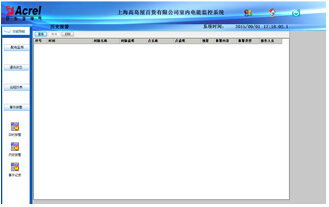
The entire interface is divided into three sections, a title interface, a system interface, and a menu switching interface.
Title interface

In the title interface, the current time of the currently logged in user and system will be displayed.
Menu switching interface
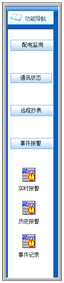
The buttons arranged on the menu switching interface are the function switching buttons of the system. By clicking on different function buttons, you can enter the corresponding function interface.
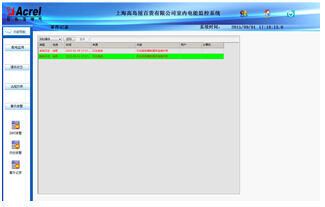
system interface
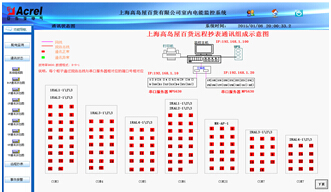
system interface
The system interface can view the work of each power distribution circuit and the main electrical parameters. The main data includes: three-phase current, electrical energy. When you choose to log in to the system as “Administratorâ€, you can click the loop name in the system map to modify the loop name directly. After the modification, the system will automatically save it.
Communication status
Communication status function
After entering the communication state, you can see the distributed network structure of the entire system, which has network diagnostic function. It can monitor the network communication status of the system in real time. When a network failure occurs, the system automatically displays the fault line and specific unit.
Energy report
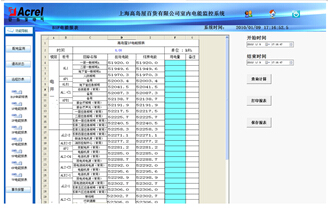
Energy report function
The management of power consumption is presented in the form of a report. The report can display the power consumption of each loop in any period of time during the system operation, and is produced in a table for easy query.
By adjusting the start time and end time, you can display the power consumption during this time period.
The report can be exported as a spreadsheet with print capabilities.
Alarms and events
Real-time alarm
Telemetry real-time alarm function
The real-time alarm window monitors the telemetry collected by the system. The alarm window opens automatically when the system is running and remains hidden in the background.
When there is current or voltage limit and the alarm limit is reached, the “Real-time real-time alarm†window will pop up automatically, and the specific alarm information will be displayed in red font: loop name, over-limit electric parameter, alarm value, etc.
Historical alarm
Alarm history query function
In the historical alarm interface, click the Query button. By adjusting the start time and end time, you can query the system alarm information in any past time period, including telemetry alarm and remote alarm, including the specific alarm time, alarm type, and alarm. Content, etc.
System event
System event query function
You can view the operation of each part of the system in the current state, and select "Event Query" to query the operation at any time.
User Management
Click "User Management", "User Login", "User Logout" in the menu bar.
The system provides users with three functions related to user identity and management. User login can be used to switch the identity of the logged-in user. The logged-in user can delete the logged-in user's identity through User Logout. The administrator can modify the login password of all users through User Configuration. Use Add Delete to add a user identity, or delete an existing user identity.
4 Conclusion
In today's distribution facilities, the distribution security of large commercial buildings is of paramount importance. The application of the Acrel-3000 power management system described in this paper in Shanghai Gaodaowu can realize the power supply to the substation supply and distribution circuits. The real-time monitoring can not only display the power consumption of the loop, but also have the network communication function, and can form a power monitoring system with the serial port server and the computer. The system realizes the analysis and processing of the collected data, displays the running status of each distribution circuit in the substation in real time, and has a pop-up alarm dialog box, voice prompt, SMS alarm light for the closing and closing of the load, and generates various energy reports. Analyze curves, graphs, etc., to facilitate remote meter reading and analysis and research of electric energy. The system is safe, reliable and stable, providing a real and reliable basis for the factory to solve the problem of electricity consumption, and has achieved good business benefits.
references:
[1]. Ren Zhicheng Zhou Zhong. Principles and Application Guidelines of Power Electrical Measurement Digital Instrumentation [M]. Beijing. China Electric Power Press. 2007. 4
[2]. Zhou Zhongbian. Smart grid customer power monitoring and power management system product selection and solution [M]. Beijing. Mechanical Industry Press. 2011.10
About the author: Yang Junjun, female, undergraduate. Position: Now working for Ankerui Electric Co., Ltd., contact number, mobile phone, QQ
Http://news.chinawj.com.cn Editor: (Hardware Business Network Information Center) http://news.chinawj.com.cn
Yang Junjun
Ankerui Electric Co., Ltd., Jiading, Shanghai 201801, China;
1 Overview
Takashimaya Department Store's 180-year-old Takashimaya is one of the largest chain department stores in Japan. It has more than 20 chain stores in Japan and its revenue in 2007 was the highest among all Japanese department stores. So far, Takashimaya Department Store has only opened three overseas stores, namely New York, Taipei and Singapore, which are among the top local sales charts. Among them, Singapore Takashimaya and Taipei Takashimaya have been linked to local department stores for many years. Industry sales champion.
Shanghai Gaodaowu Department Store is located in the second phase of Gubei International Wealth Center in the golden section of Hongqiao Road and Ruby Road. The second phase of Fortune Center is 30 stories high. It is a high-end commercial, five-star hotel and shopping center. Super 5A Class A intelligent business building.
Our company undertakes the power management system of this project, collects the data of the floor user terminal energy meter in real time, and analyzes and manages the user's power consumption, so as to facilitate the user's real-time understanding of the floor power consumption.
1 Demand analysis
The implementation of this power management system achieves the predetermined goals in the following aspects:
1) Master the operation of the power equipment of each end user;
2) Report on various status monitoring and historical data in the power management system. The system can design and manage multiple report styles to realize daily, monthly and annual report management;
3) data recording and fault data recording;
4) Improve the efficiency of the operation and management of the power management system and greatly improve the management level;
5) Realize fault information alarm, alarm inquiry, set pre-alarm signal and fault alarm signal, prompt the user through sound and light, interface, etc., wait for the user to confirm and reset, and can provide alarm information printing function.
6) Powerful user management function, the system records each administrator's operation record, operation record, etc., and sets up multiple levels of users, respectively assign different permissions and corresponding passwords to ensure safe operation. Realize no or few people on duty in each substation;
2 system plan
The monitoring system mainly implements power management for the end users of Shanghai Gaodaowu. The monitoring scope is remote real-time data acquisition, processing, analysis and display of the end user. The system accesses 461 terminal meters in the floor electric well, which is divided into 22 buses. The bus directly accesses the indoor collection equipment of the duty, so that the data connection between the instrument on the bus and the monitoring host is realized on the monitoring host. As shown in the figure below: station management layer, network communication layer and field device layer.
1) Station management
The management of the station control management system for the power monitoring system is a direct window for human-computer interaction. It mainly refers to the industrial computer, display, UPS, printer, etc. placed in the duty room.
2) Network communication layer
The communication layer is mainly composed of two NPORT5610-16 serial servers, protocol isolation converters, Ethernet devices and bus networks. The main function of the NPORT5610-16 serial server is to monitor the on-site intelligent instrument; the main function of the Ethernet device and the bus network is to realize data interaction, make the distribution system management centralized, informative and intelligent, and greatly improve the safety of the power distribution system. Sex, reliability and stability have truly achieved unattended goals.
3) Field device layer
The field device layer is a data acquisition terminal, which is mainly composed of smart meters. The smart meter connects to the communication server through the shielded twisted pair RS485 interface, and uses the MODBUS communication protocol bus type connection to reach the communication server through the communication server to realize the networking. remote control.
Smart meter field connection
The field instrument is connected by hand-shielded through the shielded twisted pair cable (RVVSP2*1.0). The number of smart meters connected to each bus is about 24, and then the data is uploaded to the serial port server NPORT5630-16, and the data is uploaded to the local monitoring. terminal. The specific connection diagram is as follows:
The user side uses the terminal meter DDSD1352-C and DTSF1352-C to measure single-phase (three-phase) voltage, current, active power, reactive power, frequency, power factor and so on.
3 system function
Features
The system adopts full Chinese interface, and the operation is simple and convenient; the operation is stable and reliable. Click the corresponding shortcut button to enter the corresponding system function module; the system has the terminal meter power consumption display, simulation map display and network structure diagram display; the system provides a friendly human-computer interaction interface, all operations can be performed on the interface And has a remote display function.
login interface
After the software enters the corresponding password, it can enter the monitoring system interface and view the monitoring data. Otherwise, it cannot be viewed. The user name is divided into "administrator" and "operator". The two permissions are different. The operator can only operate some functions, and the administrator has the highest authority.
The entire interface is divided into three sections, a title interface, a system interface, and a menu switching interface.
Title interface
In the title interface, the current time of the currently logged in user and system will be displayed.
Menu switching interface
The buttons arranged on the menu switching interface are the function switching buttons of the system. By clicking on different function buttons, you can enter the corresponding function interface.
system interface
system interface
The system interface can view the work of each power distribution circuit and the main electrical parameters. The main data includes: three-phase current, electrical energy. When you choose to log in to the system as “Administratorâ€, you can click the loop name in the system map to modify the loop name directly. After the modification, the system will automatically save it.
Communication status
Communication status function
After entering the communication state, you can see the distributed network structure of the entire system, which has network diagnostic function. It can monitor the network communication status of the system in real time. When a network failure occurs, the system automatically displays the fault line and specific unit.
Energy report
Energy report function
The management of power consumption is presented in the form of a report. The report can display the power consumption of each loop in any period of time during the system operation, and is produced in a table for easy query.
By adjusting the start time and end time, you can display the power consumption during this time period.
The report can be exported as a spreadsheet with print capabilities.
Alarms and events
Real-time alarm
Telemetry real-time alarm function
The real-time alarm window monitors the telemetry collected by the system. The alarm window opens automatically when the system is running and remains hidden in the background.
When there is current or voltage limit and the alarm limit is reached, the “Real-time real-time alarm†window will pop up automatically, and the specific alarm information will be displayed in red font: loop name, over-limit electric parameter, alarm value, etc.
Historical alarm
Alarm history query function
In the historical alarm interface, click the Query button. By adjusting the start time and end time, you can query the system alarm information in any past time period, including telemetry alarm and remote alarm, including the specific alarm time, alarm type, and alarm. Content, etc.
System event
System event query function
You can view the operation of each part of the system in the current state, and select "Event Query" to query the operation at any time.
User Management
Click "User Management", "User Login", "User Logout" in the menu bar.
The system provides users with three functions related to user identity and management. User login can be used to switch the identity of the logged-in user. The logged-in user can delete the logged-in user's identity through User Logout. The administrator can modify the login password of all users through User Configuration. Use Add Delete to add a user identity, or delete an existing user identity.
4 Conclusion
In today's distribution facilities, the distribution security of large commercial buildings is of paramount importance. The application of the Acrel-3000 power management system described in this paper in Shanghai Gaodaowu can realize the power supply to the substation supply and distribution circuits. The real-time monitoring can not only display the power consumption of the loop, but also have the network communication function, and can form a power monitoring system with the serial port server and the computer. The system realizes the analysis and processing of the collected data, displays the running status of each distribution circuit in the substation in real time, and has a pop-up alarm dialog box, voice prompt, SMS alarm light for the closing and closing of the load, and generates various energy reports. Analyze curves, graphs, etc., to facilitate remote meter reading and analysis and research of electric energy. The system is safe, reliable and stable, providing a real and reliable basis for the factory to solve the problem of electricity consumption, and has achieved good business benefits.
references:
[1]. Ren Zhicheng Zhou Zhong. Principles and Application Guidelines of Power Electrical Measurement Digital Instrumentation [M]. Beijing. China Electric Power Press. 2007. 4
[2]. Zhou Zhongbian. Smart grid customer power monitoring and power management system product selection and solution [M]. Beijing. Mechanical Industry Press. 2011.10
About the author: Yang Junjun, female, undergraduate. Position: Now working for Ankerui Electric Co., Ltd., contact number, mobile phone, QQ
Http://news.chinawj.com.cn Editor: (Hardware Business Network Information Center) http://news.chinawj.com.cn
Industrial Indoor Illumination
The LED indoor light are high-quality and energy-efficient, providing bright and uniform illumination with minimal energy consumption.
The light also has a high color rendering index, which means it can accurately display the true colors of objects and environments.
Industrial Illumination,Led Tunnel Light,Electricity Saving Led Bulb,Power Saving Led Bulb
Henan Idui Import and Export Trade Co., Ltd , http://www.acesunraylight.com